Genetics~
Examining Genetic Crosses Using Corn
Genetics~
Examining Genetic Crosses using Corn
Examining Genetic Crosses using Corn
Objectives:
1. Solve monohybrid and dihybrid cross problems.
2. Use sampling to determine phenotypic ratios of a visible trait in the corn.
3. Form hypotheses about genotypic and phenotypic ratios in the F2 generation of corn crosses.
4. Use chi-square tests to determine whether observed results are consistent with expected results.
Background Information:
In 1866, Gregor Mendel presented his findings on the inheritance of traits in garden peas and today his work is celebrated as the bases of modern genetics. Mendel was the first person to successfully derive the rules of genetics. He conducted careful, systematic experiments, and analyzed his data mathematically. He proposed that an organism carries two "units" for each visible character, but contributes only on inherited from each parent. Mendel worked with garden peas that are true-breeding, so all self-fertilized offspring display the same form of a trait as their parent. Mendel noted patterns of inheritance known as "Laws", due to the nature of genes, chromosomes and gametes (sperm, eggs, pollen).
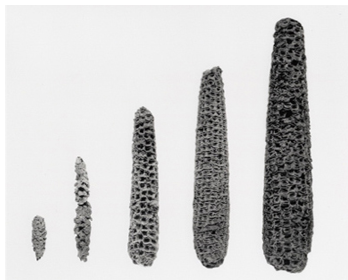
Corn is used used in this experiment because mature corn plants produce ears that contain hundreds of kernels. Each kernel is formed by the fertilization of an egg by a male gamate (pollen). Therefore, each kernel can grow into a whole new plant and contains hundreds of offspring from a single parental cross and and illustrates the results of traits being passed on from parents to a large number of offspring. The corn cob has kernels that are either purple or yellow. The color of the corn fruit is inherited in the same way as the color of the flowers on Mendel's peas.
Monohybrid is a single trait that results from a single gene. Dihybrid two traits that result from two separate genes on two separate chromosomes. The physical appearance of the corn kernels helps determine the phenotype of two characters: kernel color and carbohydrate content. There are two different alleles for each gene: purple vs. yellow, and starch (plump) vs. sweet (wrinkled). The results of your counting will describe: Mendel's Laws of Inheritance (The Law of Segregation and The Law of Independent Assortment). The law of segregation states that for any particular trait, the pair of alleles of each parent separate, and only one allele passes from each parent on to an offspring. In the law of independent assortment, different pairs of alleles are passed to offspring independently of each other. So in the corn lab, a kernel of corn has an equal chance of being purple and plump as it does purple and wrinkled (or yellow and plump vs yellow and wrinkled) because the alleles separate into gametes independently of one another during meiosis when the gametes are being formed and the chromosomes (with the genes) are separating. The result of this experiment is that new combinations of genes present in neither parent are possible and there is a tremendous amount of diversity within a population.
Take note that the color variants that they have are purple ( dominant) and yellow (recessive). The starch variants that they have are starchy, which is smooth in appearance (dominant) and sugary, which is wrinkled in appearance (recessive).
Additional Information
Take note that the color variants that they have are purple ( dominant) and yellow (recessive). The starch variants that they have are starchy, which is smooth in appearance (dominant) and sugary, which is wrinkled in appearance (recessive).
Additional Information
- http://www.carolina.com/teacher-resources/Interactive/corn-ears-for-genetics/tr10691.tr
- http://learn.genetics.utah.edu/content/selection/corn/
- http://www.carolina.com/teacher-resources/Interactive/corn-ears-for-genetics/tr10691.tr
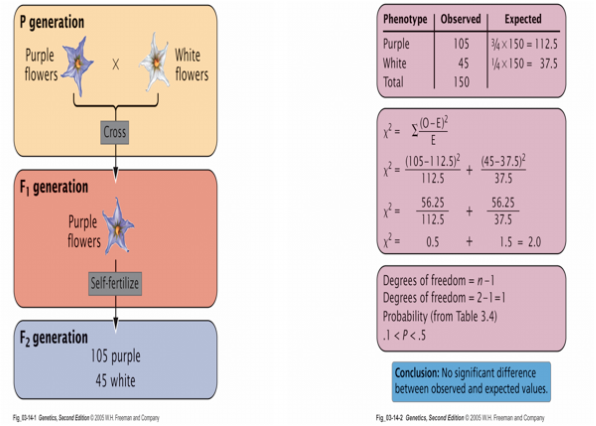
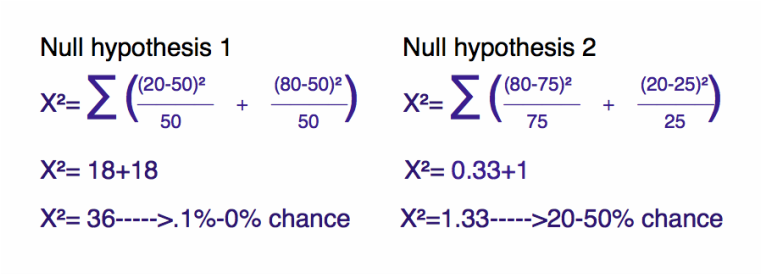
Below is an example application of chi-squared which will be completed later in the experiment.
*************************************
Procedures:
Developing Your Null Hypothesis:
Monohybrid Corn A
Developing Your Null Hypothesis:
Monohybrid Corn A
MONOHYBRID CORN A (above picture)
1. Students work in pairs.
2. Start with monohybrid cross; obtain a corncob labeled A.
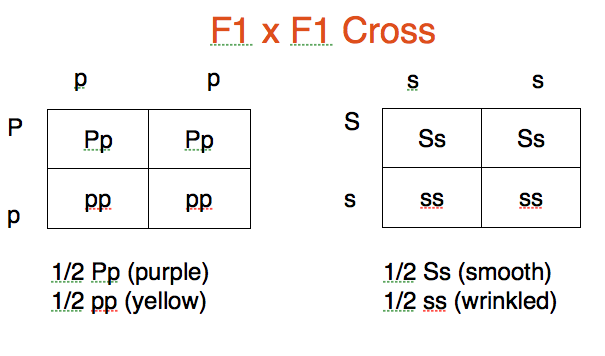
3. Draw two Punnett squares for the possible crosses to represent your null hypothesis. Label Punnett squares as a null hypotheses number one and number two. The possible crosses and the results are shown in the two images below.
2. Start with monohybrid cross; obtain a corncob labeled A.
3. Draw two Punnett squares for the possible crosses to represent your null hypothesis. Label Punnett squares as a null hypotheses number one and number two. The possible crosses and the results are shown in the two images below.
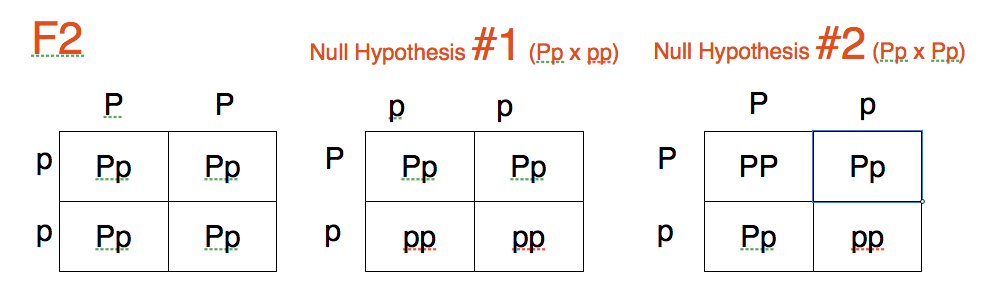
4. Null Hypothesis number 1
Look at your Punnett square and record information about the F2 generation.
1)List the gametes of the F1: P,p,p,p
2) List the genotypes of the F2: Pp,Pp,pp,pp
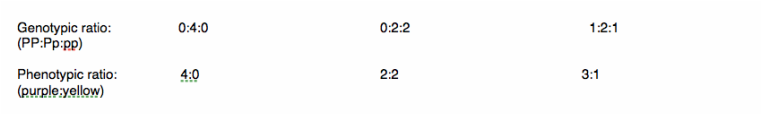
3) List the phenotypes of the F2: 2 purple: 2 yellow
Null Hypothesis number 2
Look at your Punnett square crosses and record information about the F2 generation.
1) List the gametes of the F1: P, p, p, p
2) List the genotypes of the F2: Pp, pp
3) List the phenotypes of the F2: 2 purple: 2 yellow
5. Answer the questions based on your F1xF1 Punnett square
Null hypotheses 1
What proportion of the kernels on YOUR cob do you expect to be purple? 1/2
What proportion of the kernels on YOUR cob do you expect to be yellow? 1/2
Null hypothesis 2
What proportion of the kernels on YOUR cob do you expect to be purple? 3/4
What proportion of the kernels on YOUR cob do you expect to be yellow? 3/4
6. Count 100 kernels of the corn on your cob. Record the OBSERVED results:
Purple: 80 Yellow: 20 Total=100
Look at your Punnett square and record information about the F2 generation.
1)List the gametes of the F1: P,p,p,p
2) List the genotypes of the F2: Pp,Pp,pp,pp
3) List the phenotypes of the F2: 2 purple: 2 yellow
Null Hypothesis number 2
Look at your Punnett square crosses and record information about the F2 generation.
1) List the gametes of the F1: P, p, p, p
2) List the genotypes of the F2: Pp, pp
3) List the phenotypes of the F2: 2 purple: 2 yellow
5. Answer the questions based on your F1xF1 Punnett square
Null hypotheses 1
What proportion of the kernels on YOUR cob do you expect to be purple? 1/2
What proportion of the kernels on YOUR cob do you expect to be yellow? 1/2
Null hypothesis 2
What proportion of the kernels on YOUR cob do you expect to be purple? 3/4
What proportion of the kernels on YOUR cob do you expect to be yellow? 3/4
6. Count 100 kernels of the corn on your cob. Record the OBSERVED results:
Purple: 80 Yellow: 20 Total=100
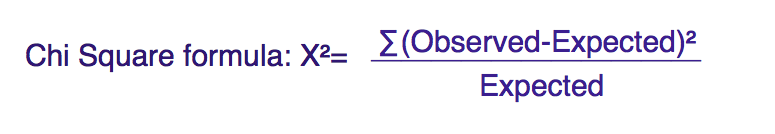
Statistical background- In science, we form hypotheses to try to explain something. we then design an experiment to test the hypothesis. The hypothesis predicts that we will get certain results from the experiment. But if, in fact, we et these results, is it possible that the results are due to the chance, rather than that the hypothesis is correct? This is possible, so we use a statistical test called Chi Square, (x2), to let us know the likelihood that our results were due to chance, rather than the hypothesis being correct. This single value, (x2), can then be compared to a Chi Square Table of Probabilities to determine at what level of confidence you can trust that your collected data actually reflects the expected values. The symbol ∑ means "sum of". When you see this symbol, you add the values that follow.
Degree of freedom= number of classes-1
so, 2 classes-1= 1 degree of freedom
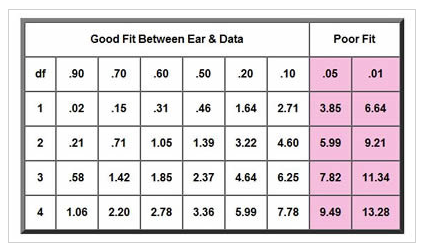
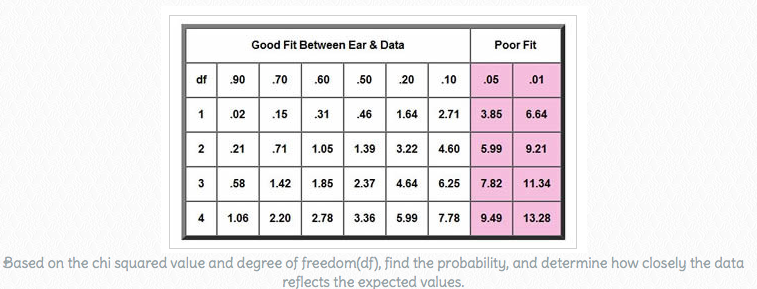
Based on the chi squared value and degree of freedom(df), find the probability, and determine how closely the data reflects the expected values.
7. Use the data found by counting the 100 kernels and calculate the chi-squared value.
8. Find the sum of the "deviation squared/expected" to determine the chi squared value on the probability chart.
8. Find the sum of the "deviation squared/expected" to determine the chi squared value on the probability chart.
9. Do you agree with the proportions that were expected after completing the chi-squared test? yes
Chi squared probability value for null hypothesis #1: 36 (0.1-0% chance)
Chi squared probability value for null hypothesis #2: 1.33 (20-50% chance)
Which is the correct value? Why? The correct value is 1.33 because these values are closer to the expected values of 75 purple and 25 yellow. This is the reason why the likelihood of these results is relatively high when the parents are Pp x Pp the chi-squared value falls in the accepted value range for df=1.
*************************************
Dihybrid Cross: P1 cross= PPSS x ????,
F2 Generation is corn B.
F2 Generation is corn B.
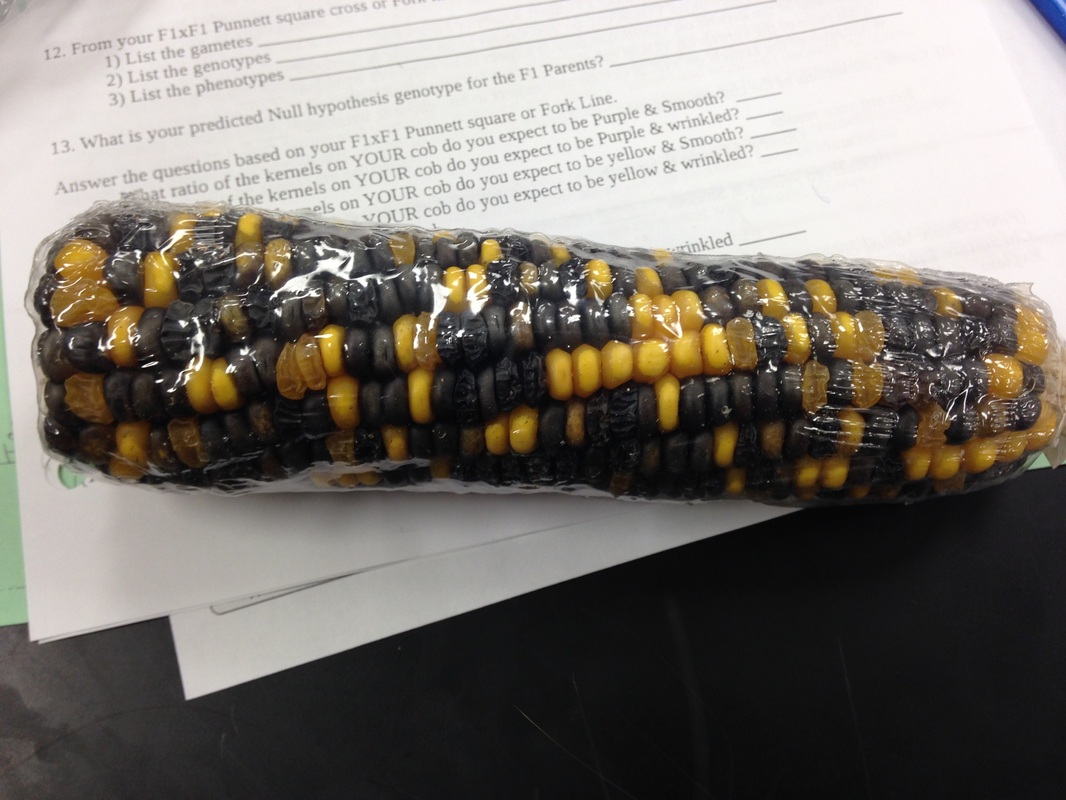
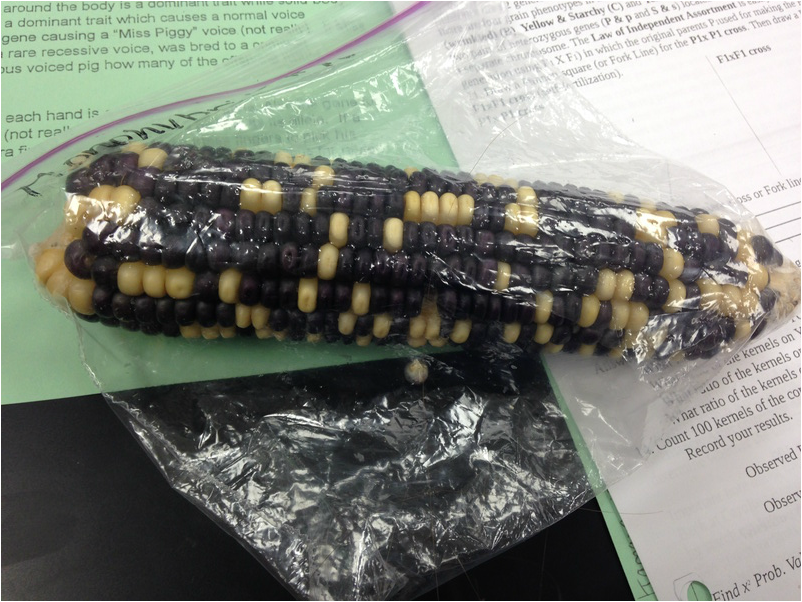
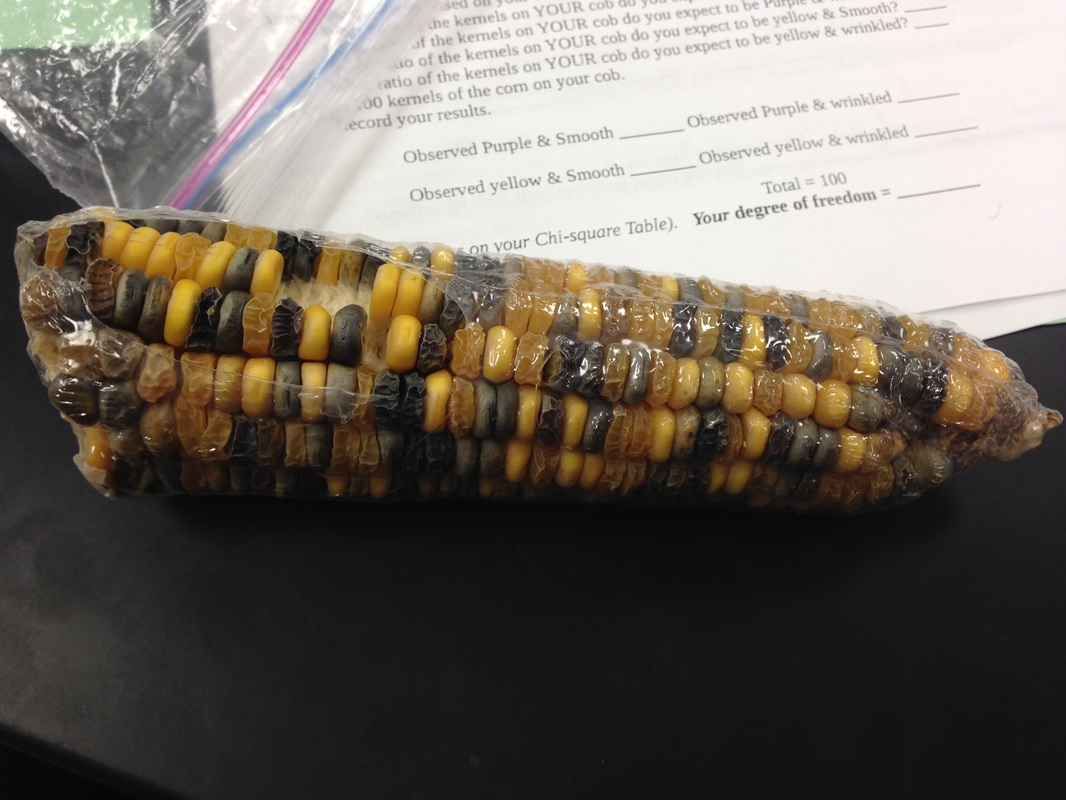
Dihybrid Corn B (above picture)
Now you will begin the dihybrid cross; obtain a corncob labeled B. This photo of an ear of "corncob B" illustrates the F2 generation from a dihybrid cross, showing the four different genes and grain types. In the photo, there are four grain phenotypes in the ear of genetic corn: Purple and Smooth, Purple and Wrinkled, Yellow and Smooth, and Yellow and Wrinkled. These four grain phenotypes are produced by the two pairs of heterozygous genes (P & p and S & s) located on 2 pairs of homologous chromosomes, each gene on a separate chromosome. The Law of Independent Assortment is easily demonstrated using an F2 cross (second generation using F1 x F1) in which the original parents P1 used for making the F1 is differed in two traits.
1. Draw the punnet squares for the P1xP1 cross and the F1xF1 cross.
1. Draw the punnet squares for the P1xP1 cross and the F1xF1 cross.
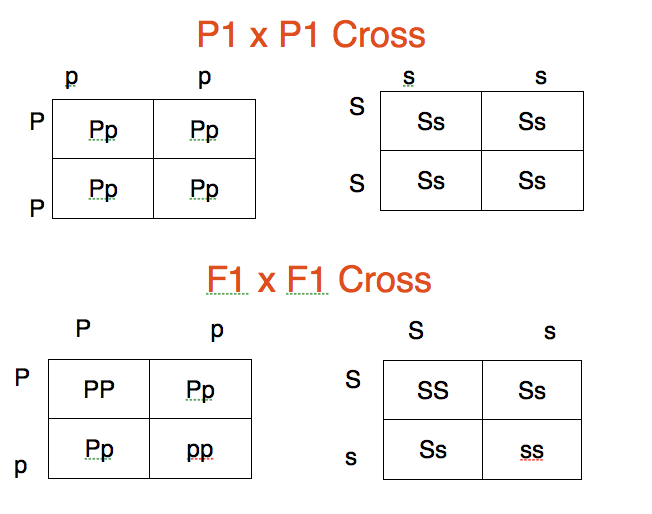
2. Look at your Punnett squares for F1 x F1 and record information about the F2 generation.
1)List the gametes of the F1: PS,Ps,pS,ps
2) List the genotypes of the F2: PPSS, PPSs, PPss, PpSS, PpSs, Ppss, ppSS, ppSs, ppss
3) List the phenotypes of the F2: purple and smooth, yellow and smooth, purple and
wrinkled, yellow and wrinkled.
3. What is your predicted Null hypothesis for the genotype of the F1 parents? PpSs x PpSs
What ratio of the kernels on YOUR cob do you expect to be Purple & Smooth? 9/16
What ratio of the kernels on YOUR cob do you expect to be Purple & Wrinkled? 3/16
What ratio of the kernels on YOUR cob do you expect to be Yellow & Smooth? 3/16
What ratio of the kernels on YOUR cob do you expect to be Yellow & Wrinkled? 1/16
4. Count the kernels on the cob and record the results.
Observed Purple & Smooth 60 Observed Purple & Wrinkled 15
Observed Yellow & Smooth 19 Observed Yellow & Wrinkled 6
Total=100
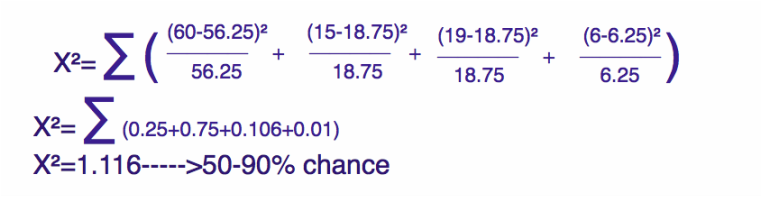

Your degree of freedom=3
Chi Square Probability Values: 1.116 (50-90% chance)
Did you reject or accept your Null hypothesis? Accept the null hypothesis because the likelihood of the found results to occur is very high given the parents with genotypes of PpSs x PpSs and the chi-squared value falls in the accepted value range for df=3.
*************************************
Dihybrid Cross: F1 cross= PPSS x ????,
F2 Generation is corn C.
Dihybrid Cross: F1 cross= PPSS x ????,
F2 Generation is corn C.
Dihybrid Corn C
Now you will begin another dihybrid cross; obtain a corncob labeled C. Corncob C shows four different genes and grain types. There are four grain phenotypes in the ear of genetic corn: Purple & Smooth, Purple & Wrinkled, Yellow & Smooth and Yellow & Wrinkled. These four grains phenotypes are produced by the two pairs of genes (P & p and S & s) located on two pairs of homologous chromosomes, each gene on separate chromosome. Look over the ear of corn and think of the possible null hypothesis ratio which explains the phenotypic characteristics of corn C. The original P1 was purple, smooth and the other P1 yellow, wrinkled.
1. Draw a punnet square to predict a possible F1xF1 cross. Then predict the F1xF1 cross.
1. Draw a punnet square to predict a possible F1xF1 cross. Then predict the F1xF1 cross.
2. Look at your Punnett squares for F1 x F1 cross.
1)List the gametes of the F1: PS, Ps, pS, ps x ps
2) List the genotypes of the F2: PpSs, Ppss, ppSs, ppss
3) List the phenotypes of the F2: purple and smooth, yellow and smooth, purple and
wrinkled, yellow and wrinkled.
3. What is the predicted Null hypothesis for the F1 parents? PpSs x ppss
Based on the F1xF1 cross...
What ratio of the kernels on YOUR cob do you expect to be Purple & Smooth? 1/4
What ratio of the kernels on YOUR cob do you expect to be Purple & Wrinkled? 1/4
What ratio of the kernels on YOUR cob do you expect to be Yellow & Smooth? 1/4
What ratio of the kernels on YOUR cob do you expect to be Yellow & Wrinkled? 1/4
4. Count the kernels on the cob and record the results.
Observed Purple & Smooth 23 Observed Purple & Wrinkled 20
Observed Yellow & Smooth 27 Observed Yellow & Wrinkled 30
Total=100
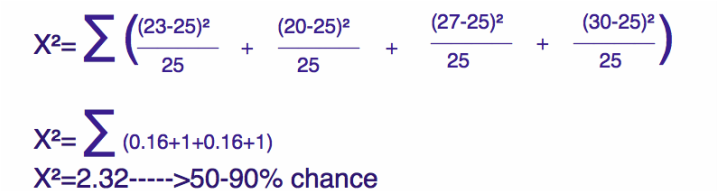
Your degree of freedom=3
Chi Square Probability Values: 2.32 (50-90% chance)
Did you reject or accept your Null hypothesis? Accept the null hypothesis because the likelihood of the found results to occur is very high given the parents with genotypes of PpSs x ppss and the chi-squared value falls in the accepted value range for df=3.
